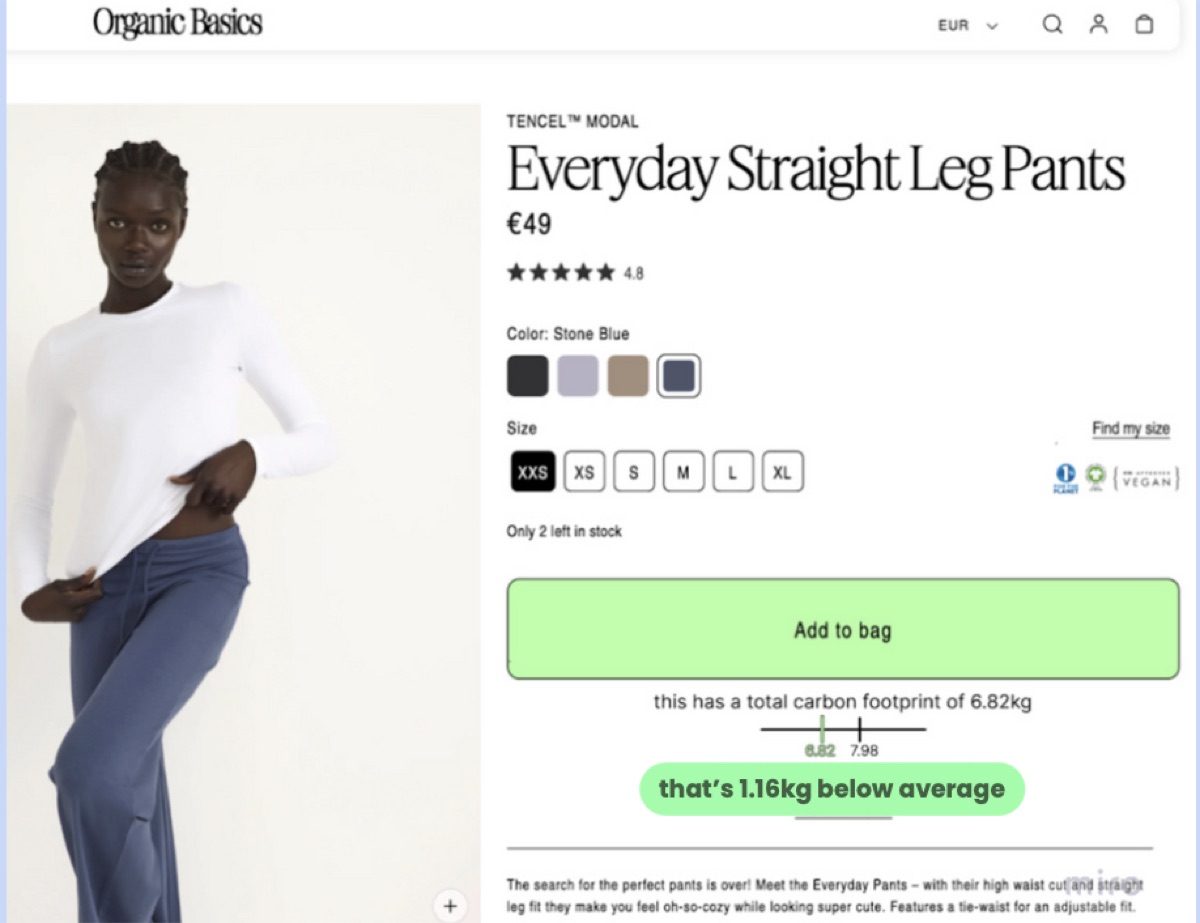
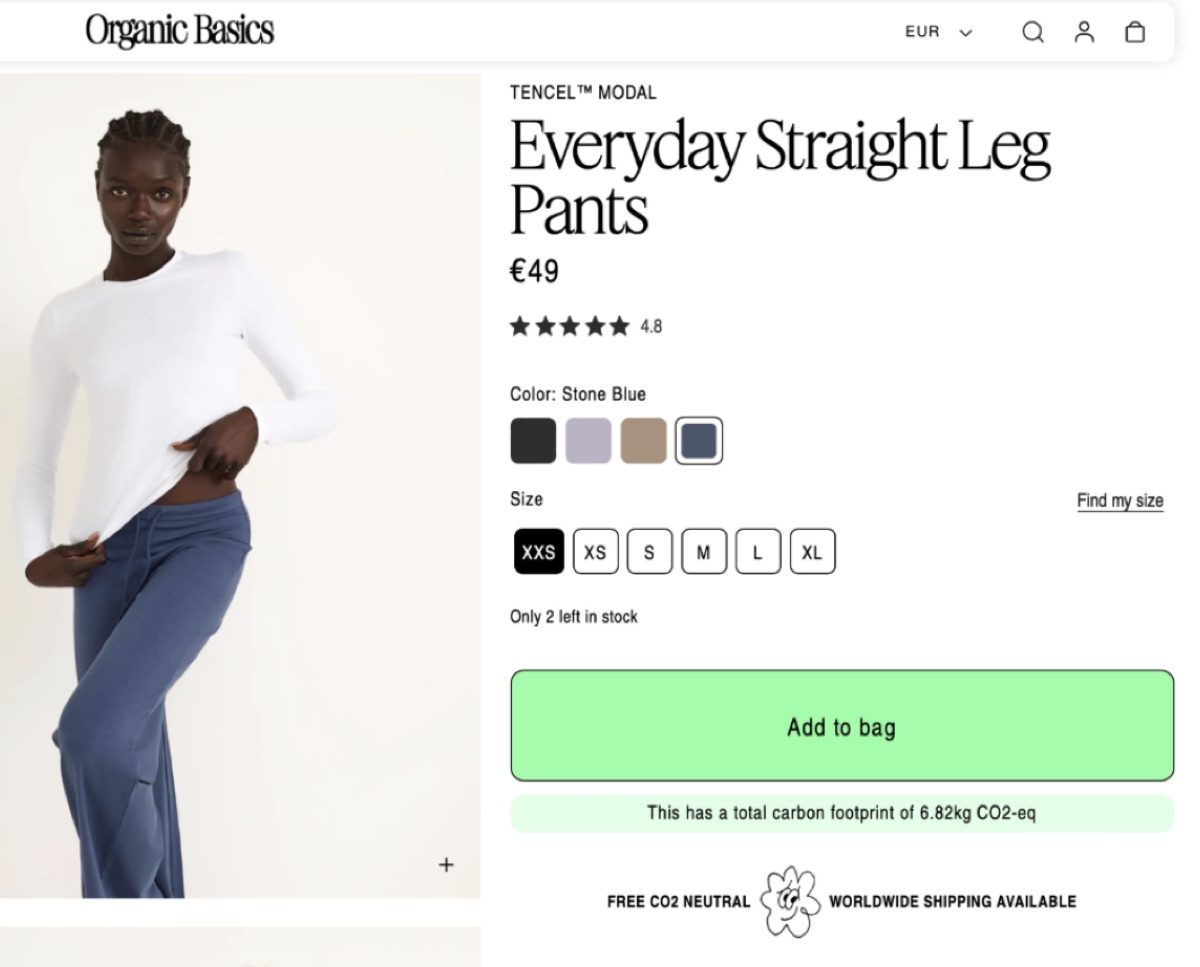
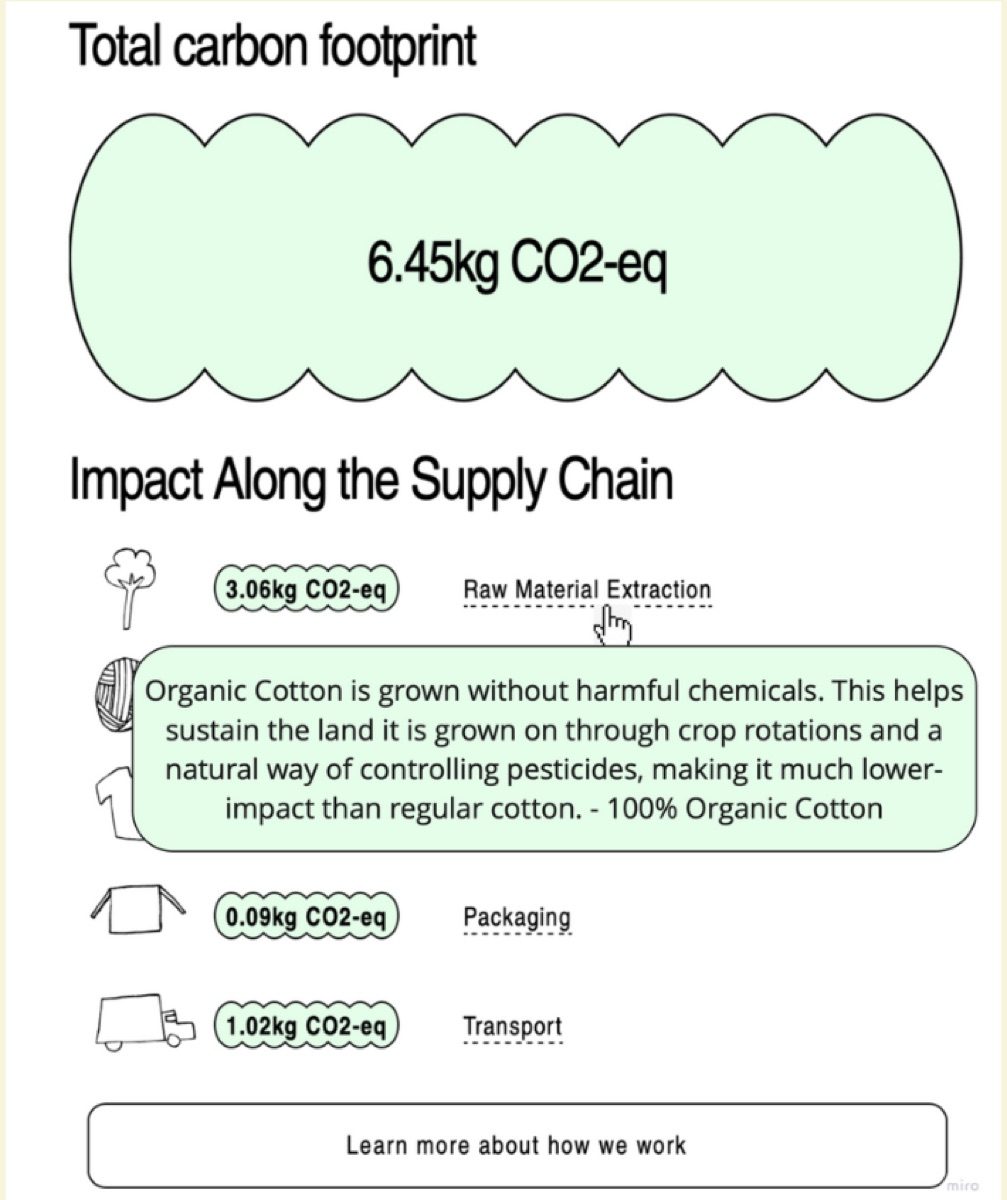
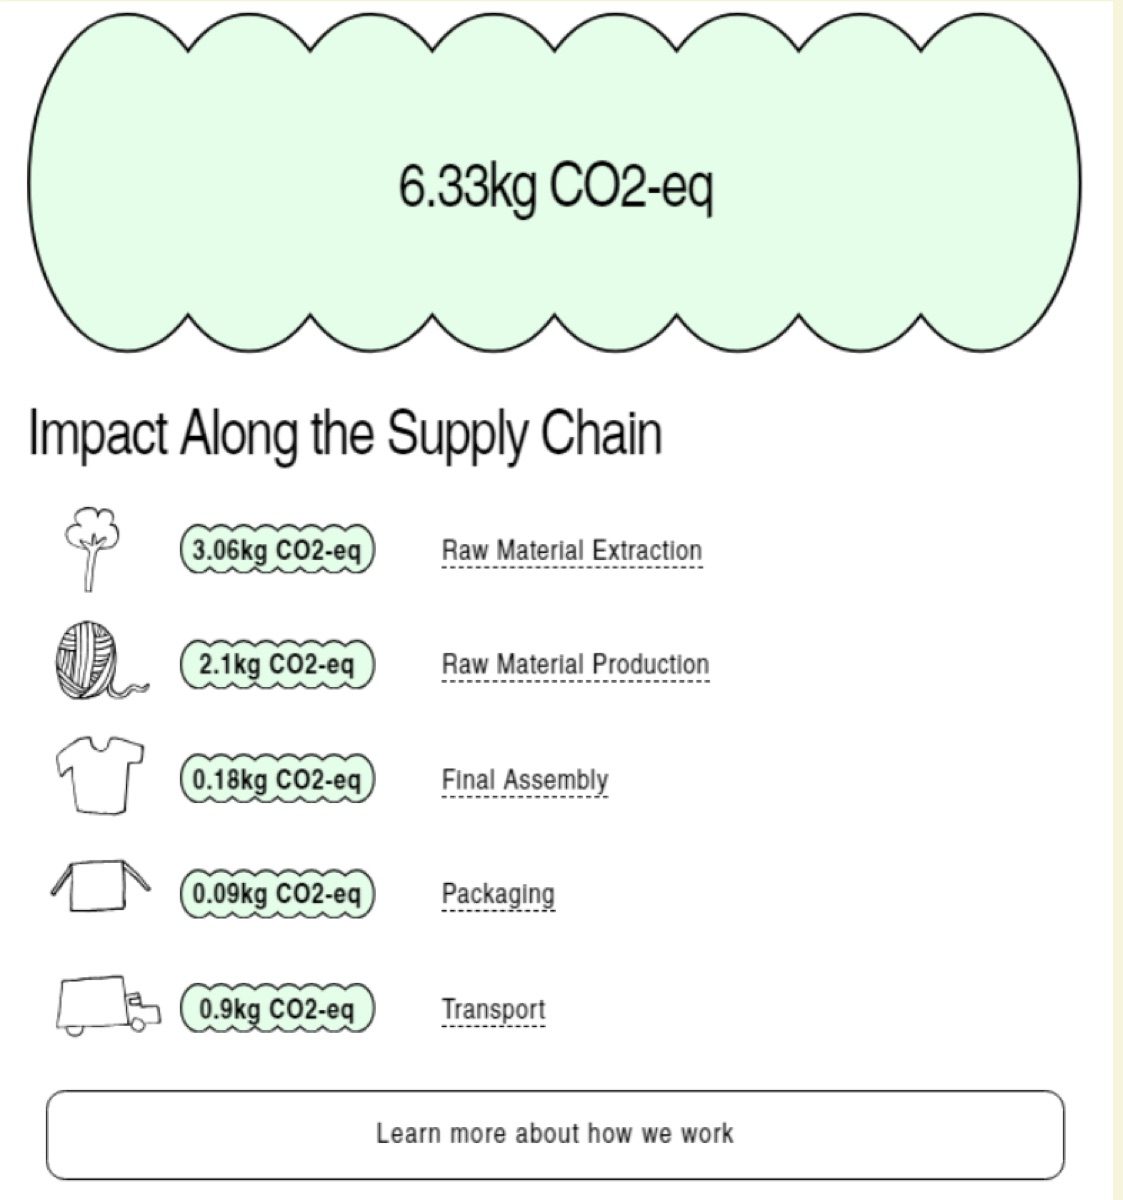
The brand builds its position on sustainability and publishes a lot of data about it. The question was whether anyone can actually get to that data and make any sense of it.The task “find information on sustainability”: 100% completion, but a 25% drop-off along the way and 3 min 16 s on average. The task “find the water usage”: 0% completion — nobody got there.The prototype: the carbon footprint broken down into the stages of the supply chain, with one number and one sentence for each. The data had been on the site all along — the problem was where and how it was shown.The data next to the product, not in a separate tab. People found the carbon footprint and could not tell whether it was a lot.Next projectFinanse 101